Part 3: DSC Protection
In the last Newsletter of this series about protecting your assets and/or access paths, I want to tell you how SOFTWARE ENGINEERING GmbH’s Bind Impact Expert DSC Protection works.
In the previous Newsletter of the series (2014-01 Dynamic SQL 2014-02 Static SQL), we have seen how with RUNSTATS Rescue you can quickly and cheaply get back your old DB2 Catalog Access Path Statistics.
How will a RUNSTATS affect my Dynamic SQL?
What happens if I reset the statistics for this statement? What are the side effects?
DSC Protection was created in order to handle this. In a nut shell, it will:
- Extract all needed DDL from production (Optional if it is already on test of course!)
- Extract all needed catalog statistics from production
- Run a “special” RUNSTATS (More on this baby later)
- Extract all needed catalog statistics from the _HIST tables in production
- Capture and Explain the DSC from production
- Export DSC from production
- Transfer all data to test
- Now logoff from production and logon to test
- Create the DDL on test (Optional)
- Import the dynamic SQL
- Update all statistics in test from the extracted _HIST data
- Explain all SQL from production DSC
- Compare the “new” Access Paths
- If for a given DB.TS the access is only “improved”,create a DB.TS pair ready to send back to production for actual RUNSTATS
- If for a given access path the result is “worsened” or “changed” then reset the statistics back to the actual production statistics and re-analyse
- Keep going until no more access paths are worsened or changed
- Transfer the RUNSTATS control cards to production
- Logoff from test and logon to production
- Run a “normal” RUNSTATS using the transferred control cards
- You are done! Simple, huh?
We start at the Main Menu:
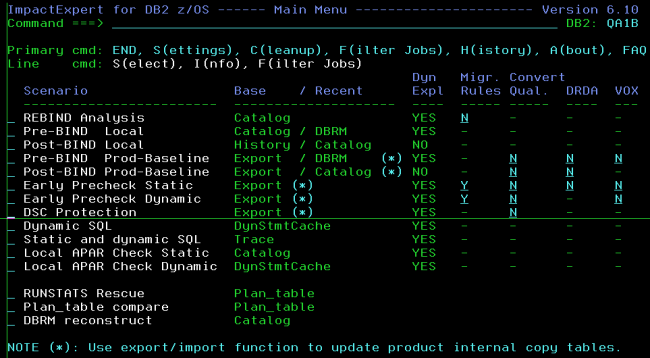
Select the DSC Protection scenario:

To begin use the primary command X to start the eXport chain of jobs:
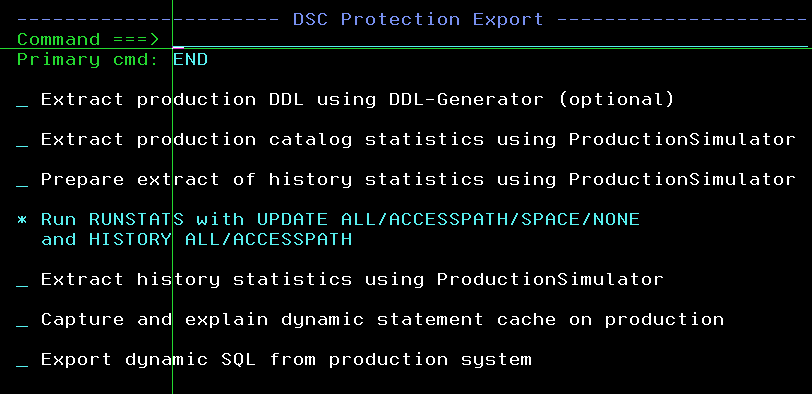
Once you get to the blue line,
you must then run the “special” RUNSTATS.
What this does, is run the RUNSTATS but does not invalidate the DSC. We do not want to kill the good access paths, we want to see if a RUNSTATS will help us first *before* we really run the RUNSTATS! That is why the scenario is called DSC protection after all! It is there to protect your DSC from a mistimed RUNSTATS.
The HISTORY option *must* be ALL or ACCESSPATH
What is very important, is that the HISTORY option *must* be ALL or ACCESSPATH. This then fills the _HIST tables with data that we need later in the analysis. Here’s another “little” problem in the fact that there is no SYSTABLESPACE_HIST table! IBM “forgot it” years ago and it has never been created… This is why there is a “prepare extract” step, as we must create a VIEW which gives us a “fake” SYSTABLESPACE_HIST table as NACTIVEF is very good for the DB2 Optimizer if you ask me!
Once all of these steps have been done and you have file transferred all the needed files across to test, you can logoff from production and log onto the test machine.
Here you select the DSC Protection scenario again:

Now you use I to Import the data:

Again you just run through the jobs a step at a time; DDL create is, of course, optional. Note that here we just apply the _HIST data – not the “current” statistics but the “future” statistics. When all of these steps are done you are then ready to use primary command N for a “new” run. Submit the job and wait for it to complete.
Once it has finished use Refresh to update the display:

and then you can use line command S to view the statements:
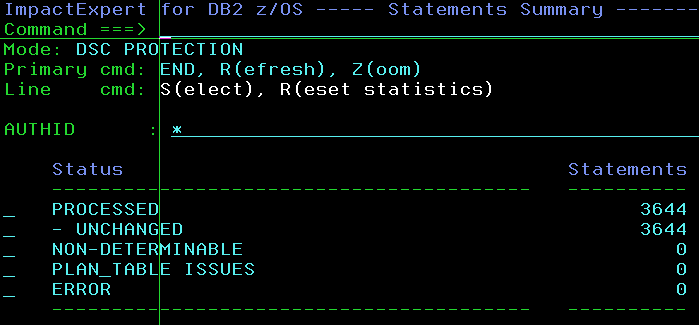
Here you see the overview and you can drill down to the statement level:
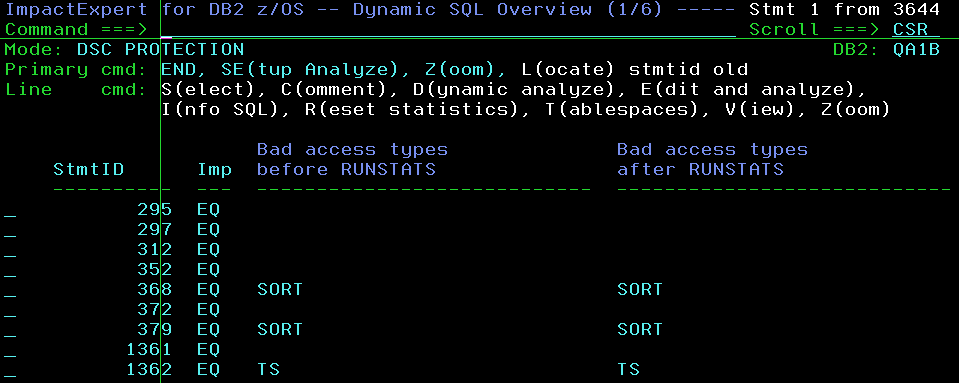
Note that on both these panels there is the R command for Reset statistics that simply adds the affected objects to an internal RUNSTATS reset table which at the entry panel can also be selected with an R:

It then displays another pop-up with a short list of options:
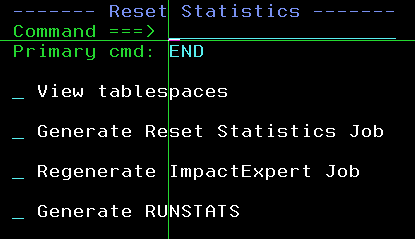
Using the first option just shows you a list of the internal RUNSTATS table where you can see the Production and Test names of the objects (Of course you can rename all the extracted data)
and you may choose whether or not specific DB.TS pairs should be added to or removed from the table:
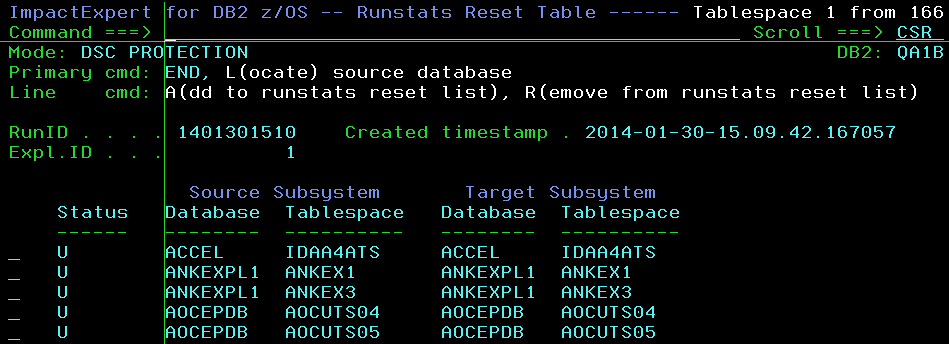
Once you have finished selecting your tables the next option should then look a little familiar to you all by now!
It uses the extracted statistics to build an update of the production data:

When it has finished and reset various statistics, you naturally want to re-run the EXPLAINs to see if the bad paths are now all gone, or perhaps even new worse ones have appeared! In my experience this never actually happens, but just to make absolutely sure, use the next option to re-generate the JCL and re-do the analysis. Now you can start all over again or you can see that all is ok. At this point you will now have a small list of DB.TS in the internal table that would actually give you guaranteed performance improvements if run on production.
Then you select the last option to see this:

And these RUNSTATS should simply be executed on Production using the normal RUNSTATS utility JCL and with UPDATE ALL or ACCESSPATH. History no longer matters of course!
Now you are done! Easy peasy lemon squeezy! (Or Easy as pie if you prefer!) That, my dear readers, is why this is *not* a pocket tool and does *not* cost pocket money (Pin money).
As usual any questions or comments are welcome,
TTFN Roy Boxwell
Senior Software Architect

